Project: Expense Tracker with Data Visualization
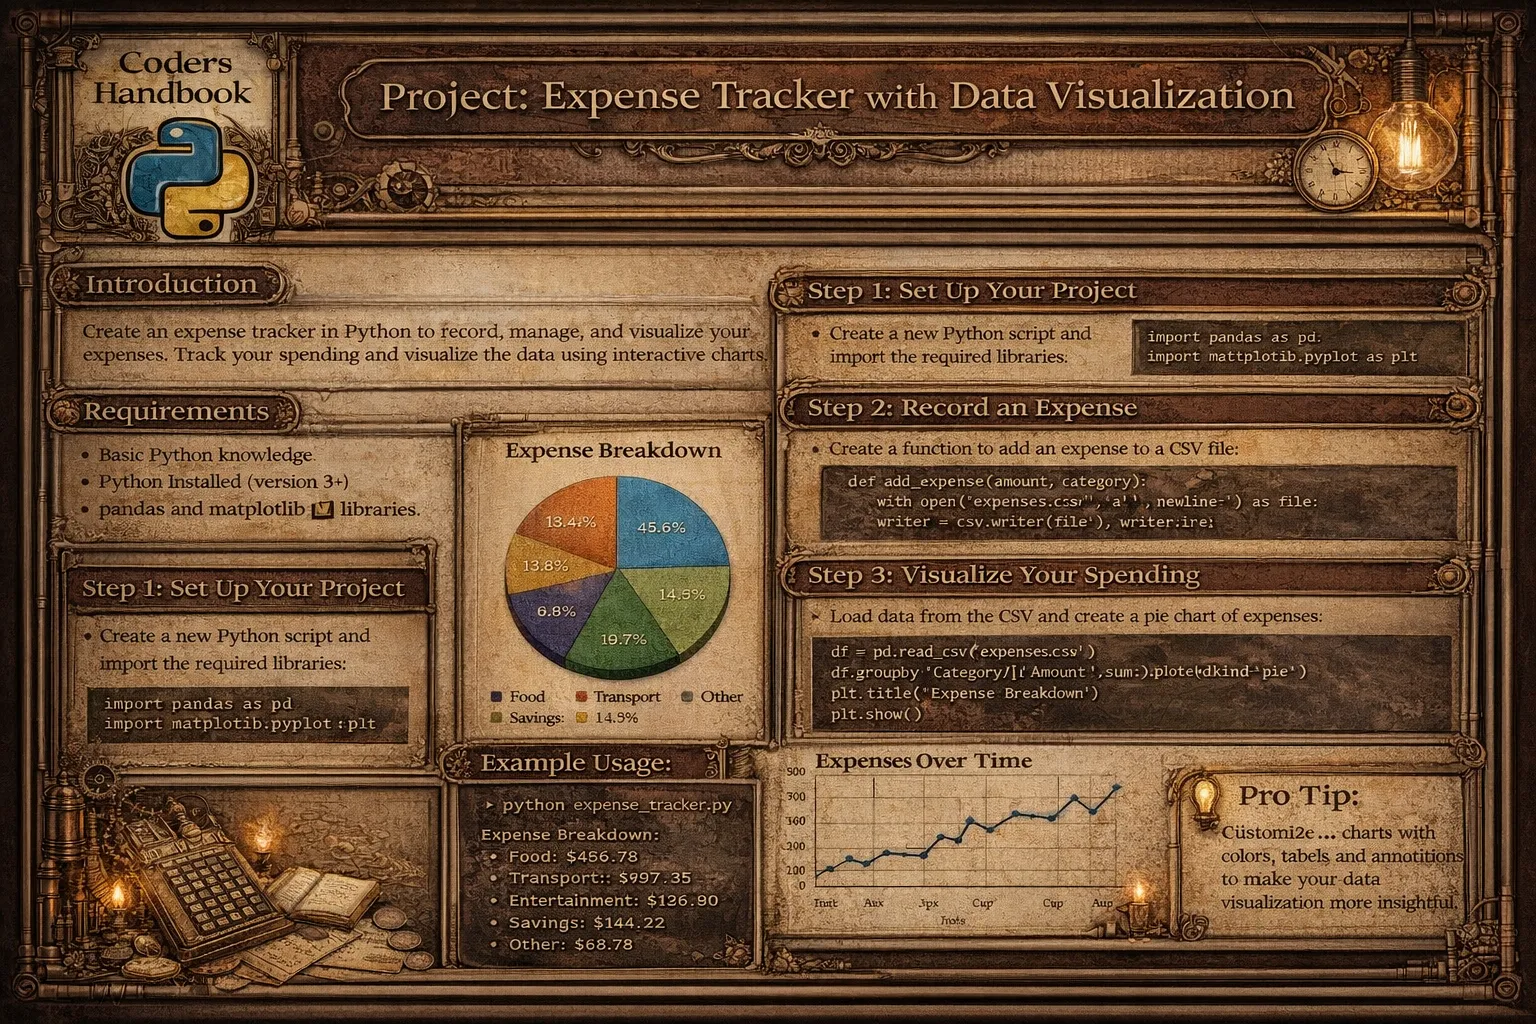
Personal finance management requires systematic tracking and analysis enabling informed spending decisions and budget optimization. This project implements comprehensive expense tracker supporting expense recording capturing date, amount, category, and description, income tracking monitoring earnings and sources, category management organizing expenses by type, data persistence storing transactions in CSV or database, report generation computing spending summaries and trends, data visualization creating charts with Matplotlib, budget monitoring comparing spending against limits, and export functionality generating shareable reports. Expense trackers enable spending awareness identifying where money goes, budget adherence tracking against financial goals, trend identification spotting patterns over time, category analysis understanding spending distribution, and financial planning making data-driven decisions, demonstrating practical application of data analysis solving everyday financial management challenges.
This comprehensive project explores data manipulation using Pandas with DataFrame structures organizing financial data, reading and writing CSV files, filtering and grouping transactions, aggregating statistics by category and period, date handling parsing transaction dates, data visualization with Matplotlib creating pie charts showing category distribution, bar charts comparing spending across categories, line graphs tracking trends over time, customizing colors, labels, and legends, financial calculations computing totals and averages, calculating budget remaining, identifying highest expenses, tracking month-over-month changes, user interface design implementing command-line menu, accepting user input with validation, displaying formatted reports, providing interactive options, data persistence saving to CSV maintaining transaction history, loading existing data on startup, appending new transactions, backing up data, and reporting generating monthly summaries, category breakdowns, comparing periods, exporting to formats. This project teaches data structures using lists and dictionaries for transactions, DataFrames for tabular data, date objects for temporal operations, file operations reading and writing CSV, handling file paths, error handling for missing files, data analysis filtering DataFrames with conditions, grouping and aggregation, computing descriptive statistics, visualization principles choosing appropriate chart types, customizing appearance, adding annotations and labels, datetime operations parsing date strings, extracting month and year, calculating date ranges, comparing periods, input validation ensuring positive amounts, validating date formats, handling invalid categories, and user experience designing intuitive menus, providing helpful messages, formatting output clearly, providing foundation for financial applications, data analysis projects, and business intelligence tools while creating immediately useful application demonstrating how programming transforms raw transaction data into actionable financial insights.
Core Expense Tracking System
The core system implements fundamental expense tracking operations including adding transactions, viewing records, and managing categories. Using Python's datetime for dates and Pandas for data management provides robust foundation supporting all tracking operations with proper validation and error handling.
# Core Expense Tracking System

import pandas as pd
import numpy as np
from datetime import datetime, timedelta
import os
import json

# Configuration
DATA_FILE = 'expenses.csv'
CATEGORIES_FILE = 'categories.json'

# Default categories
DEFAULT_CATEGORIES = [
    'Food & Dining',
    'Transportation',
    'Shopping',
    'Entertainment',
    'Bills & Utilities',
    'Healthcare',
    'Education',
    'Groceries',
    'Rent',
    'Other'
]

# === Data structure management ===

class ExpenseTracker:
    """
    Main expense tracker class.
    """

    def __init__(self, data_file=DATA_FILE):
        """
        Initialize expense tracker.

        Args:
            data_file (str): Path to data file
        """
        self.data_file = data_file
        self.df = self.load_data()
        self.categories = self.load_categories()

    def load_data(self):
        """
        Load expense data from CSV.

        Returns:
            DataFrame: Expense data
        """
        if os.path.exists(self.data_file):
            try:
                df = pd.read_csv(self.data_file)
                df['date'] = pd.to_datetime(df['date'])
                print(f"✓ Loaded {len(df)} transactions")
                return df
            except Exception as e:
                print(f"✗ Error loading data: {e}")
                return self.create_empty_dataframe()
        else:
            print("Creating new expense tracker")
            return self.create_empty_dataframe()

    def create_empty_dataframe(self):
        """
        Create empty DataFrame with proper structure.

        Returns:
            DataFrame: Empty DataFrame
        """
        return pd.DataFrame(columns=[
            'date', 'category', 'amount', 'description', 'type'
        ])

    def save_data(self):
        """
        Save data to CSV.

        Returns:
            bool: True if successful
        """
        try:
            self.df.to_csv(self.data_file, index=False)
            print(f"✓ Saved {len(self.df)} transactions")
            return True
        except Exception as e:
            print(f"✗ Error saving data: {e}")
            return False

    def load_categories(self):
        """
        Load categories from file or use defaults.

        Returns:
            list: Category list
        """
        if os.path.exists(CATEGORIES_FILE):
            try:
                with open(CATEGORIES_FILE, 'r') as f:
                    return json.load(f)
            except:
                pass

        return DEFAULT_CATEGORIES.copy()

    def save_categories(self):
        """
        Save categories to file.
        """
        try:
            with open(CATEGORIES_FILE, 'w') as f:
                json.dump(self.categories, f)
        except Exception as e:
            print(f"✗ Error saving categories: {e}")

    # === Transaction operations ===

    def add_expense(self, date, category, amount, description=''):
        """
        Add expense transaction.

        Args:
            date (str): Date in YYYY-MM-DD format
            category (str): Expense category
            amount (float): Expense amount
            description (str): Optional description

        Returns:
            bool: True if successful
        """
        return self.add_transaction(date, category, amount, description, 'expense')

    def add_income(self, date, category, amount, description=''):
        """
        Add income transaction.

        Args:
            date (str): Date in YYYY-MM-DD format
            category (str): Income category
            amount (float): Income amount
            description (str): Optional description

        Returns:
            bool: True if successful
        """
        return self.add_transaction(date, category, amount, description, 'income')

    def add_transaction(self, date, category, amount, description, trans_type):
        """
        Add transaction to tracker.

        Args:
            date (str): Date string
            category (str): Category
            amount (float): Amount
            description (str): Description
            trans_type (str): 'expense' or 'income'

        Returns:
            bool: True if successful
        """
        try:
            # Validate amount
            amount = float(amount)
            if amount <= 0:
                print("✗ Amount must be positive")
                return False

            # Parse date
            try:
                date_obj = pd.to_datetime(date)
            except:
                print("✗ Invalid date format. Use YYYY-MM-DD")
                return False

            # Validate category
            if category not in self.categories:
                print(f"⚠ Category '{category}' not in list. Adding...")
                self.categories.append(category)
                self.save_categories()

            # Create transaction
            new_transaction = pd.DataFrame([{
                'date': date_obj,
                'category': category,
                'amount': amount,
                'description': description,
                'type': trans_type
            }])

            # Add to DataFrame
            self.df = pd.concat([self.df, new_transaction], ignore_index=True)

            print(f"✓ Added {trans_type}: {category} - ${amount:.2f}")
            return True

        except ValueError:
            print("✗ Invalid amount")
            return False
        except Exception as e:
            print(f"✗ Error adding transaction: {e}")
            return False

    def delete_transaction(self, index):
        """
        Delete transaction by index.

        Args:
            index (int): Transaction index

        Returns:
            bool: True if successful
        """
        try:
            if 0 <= index < len(self.df):
                self.df = self.df.drop(index).reset_index(drop=True)
                print("✓ Transaction deleted")
                return True
            else:
                print("✗ Invalid transaction index")
                return False
        except Exception as e:
            print(f"✗ Error deleting transaction: {e}")
            return False

    def view_transactions(self, n=10, transaction_type=None):
        """
        View recent transactions.

        Args:
            n (int): Number of transactions
            transaction_type (str): Filter by type

        Returns:
            DataFrame: Transactions
        """
        if self.df.empty:
            print("No transactions found")
            return pd.DataFrame()

        df_sorted = self.df.sort_values('date', ascending=False)

        if transaction_type:
            df_sorted = df_sorted[df_sorted['type'] == transaction_type]

        return df_sorted.head(n)

    def get_transactions_by_date_range(self, start_date, end_date):
        """
        Get transactions within date range.

        Args:
            start_date (str): Start date
            end_date (str): End date

        Returns:
            DataFrame: Filtered transactions
        """
        try:
            start = pd.to_datetime(start_date)
            end = pd.to_datetime(end_date)

            mask = (self.df['date'] >= start) & (self.df['date'] <= end)
            return self.df[mask]

        except Exception as e:
            print(f"✗ Error filtering by date: {e}")
            return pd.DataFrame()

    def get_transactions_by_category(self, category):
        """
        Get transactions for specific category.

        Args:
            category (str): Category name

        Returns:
            DataFrame: Filtered transactions
        """
        return self.df[self.df['category'] == category]

print("Core expense tracking system completed!")Analytics and Reporting
Analytics functions transform transaction data into meaningful financial insights through statistical computations and summaries. These operations compute spending totals, category breakdowns, period comparisons, and budget tracking enabling users to understand spending patterns and make informed financial decisions.
# Analytics and Reporting

import pandas as pd
from datetime import datetime, timedelta
from collections import defaultdict

# === Analytics functions ===

def get_total_expenses(tracker, start_date=None, end_date=None):
    """
    Calculate total expenses.

    Args:
        tracker: ExpenseTracker instance
        start_date (str): Optional start date
        end_date (str): Optional end date

    Returns:
        float: Total expenses
    """
    df = tracker.df

    if start_date and end_date:
        df = tracker.get_transactions_by_date_range(start_date, end_date)

    expenses = df[df['type'] == 'expense']['amount'].sum()
    return float(expenses)

def get_total_income(tracker, start_date=None, end_date=None):
    """
    Calculate total income.

    Args:
        tracker: ExpenseTracker instance
        start_date (str): Optional start date
        end_date (str): Optional end date

    Returns:
        float: Total income
    """
    df = tracker.df

    if start_date and end_date:
        df = tracker.get_transactions_by_date_range(start_date, end_date)

    income = df[df['type'] == 'income']['amount'].sum()
    return float(income)

def get_balance(tracker, start_date=None, end_date=None):
    """
    Calculate balance (income - expenses).

    Args:
        tracker: ExpenseTracker instance
        start_date (str): Optional start date
        end_date (str): Optional end date

    Returns:
        float: Balance
    """
    income = get_total_income(tracker, start_date, end_date)
    expenses = get_total_expenses(tracker, start_date, end_date)
    return income - expenses

def get_category_summary(tracker, transaction_type='expense', start_date=None, end_date=None):
    """
    Get spending/income summary by category.

    Args:
        tracker: ExpenseTracker instance
        transaction_type (str): 'expense' or 'income'
        start_date (str): Optional start date
        end_date (str): Optional end date

    Returns:
        DataFrame: Category summary
    """
    df = tracker.df

    if start_date and end_date:
        df = tracker.get_transactions_by_date_range(start_date, end_date)

    # Filter by type
    df_filtered = df[df['type'] == transaction_type]

    if df_filtered.empty:
        return pd.DataFrame()

    # Group by category and sum
    summary = df_filtered.groupby('category')['amount'].agg([
        ('total', 'sum'),
        ('count', 'count'),
        ('average', 'mean')
    ]).round(2)

    # Sort by total descending
    summary = summary.sort_values('total', ascending=False)

    # Add percentage
    total_amount = summary['total'].sum()
    summary['percentage'] = (summary['total'] / total_amount * 100).round(1)

    return summary

def get_monthly_summary(tracker, year=None, month=None):
    """
    Get summary for specific month.

    Args:
        tracker: ExpenseTracker instance
        year (int): Year
        month (int): Month

    Returns:
        dict: Monthly summary
    """
    if year is None or month is None:
        now = datetime.now()
        year = now.year
        month = now.month

    # Get date range for month
    start_date = f"{year}-{month:02d}-01"

    # Calculate last day of month
    if month == 12:
        end_date = f"{year}-{month:02d}-31"
    else:
        end_date = f"{year}-{month:02d}-{pd.Period(f'{year}-{month}').days_in_month}"

    # Get transactions for month
    df_month = tracker.get_transactions_by_date_range(start_date, end_date)

    if df_month.empty:
        return {
            'year': year,
            'month': month,
            'total_income': 0,
            'total_expenses': 0,
            'balance': 0,
            'transaction_count': 0
        }

    expenses = df_month[df_month['type'] == 'expense']['amount'].sum()
    income = df_month[df_month['type'] == 'income']['amount'].sum()

    return {
        'year': year,
        'month': month,
        'total_income': float(income),
        'total_expenses': float(expenses),
        'balance': float(income - expenses),
        'transaction_count': len(df_month)
    }

def get_top_expenses(tracker, n=5, start_date=None, end_date=None):
    """
    Get top N expenses.

    Args:
        tracker: ExpenseTracker instance
        n (int): Number of top expenses
        start_date (str): Optional start date
        end_date (str): Optional end date

    Returns:
        DataFrame: Top expenses
    """
    df = tracker.df

    if start_date and end_date:
        df = tracker.get_transactions_by_date_range(start_date, end_date)

    expenses = df[df['type'] == 'expense']
    top = expenses.nlargest(n, 'amount')[['date', 'category', 'amount', 'description']]

    return top

def compare_months(tracker, year1, month1, year2, month2):
    """
    Compare two months.

    Args:
        tracker: ExpenseTracker instance
        year1, month1: First month
        year2, month2: Second month

    Returns:
        dict: Comparison results
    """
    summary1 = get_monthly_summary(tracker, year1, month1)
    summary2 = get_monthly_summary(tracker, year2, month2)

    expense_change = summary2['total_expenses'] - summary1['total_expenses']
    expense_pct = (expense_change / summary1['total_expenses'] * 100) if summary1['total_expenses'] > 0 else 0

    income_change = summary2['total_income'] - summary1['total_income']
    income_pct = (income_change / summary1['total_income'] * 100) if summary1['total_income'] > 0 else 0

    return {
        'month1': summary1,
        'month2': summary2,
        'expense_change': expense_change,
        'expense_change_percent': expense_pct,
        'income_change': income_change,
        'income_change_percent': income_pct
    }

def generate_text_report(tracker, start_date=None, end_date=None, output_file=None):
    """
    Generate text report.

    Args:
        tracker: ExpenseTracker instance
        start_date (str): Start date
        end_date (str): End date
        output_file (str): Optional output file

    Returns:
        str: Report text
    """
    # Build report
    report_lines = []
    report_lines.append("=" * 60)
    report_lines.append("EXPENSE TRACKER REPORT")
    report_lines.append("=" * 60)

    if start_date and end_date:
        report_lines.append(f"Period: {start_date} to {end_date}")
    else:
        report_lines.append("Period: All time")

    report_lines.append(f"Generated: {datetime.now().strftime('%Y-%m-%d %H:%M:%S')}")
    report_lines.append("")

    # Summary
    total_income = get_total_income(tracker, start_date, end_date)
    total_expenses = get_total_expenses(tracker, start_date, end_date)
    balance = total_income - total_expenses

    report_lines.append("FINANCIAL SUMMARY")
    report_lines.append("-" * 60)
    report_lines.append(f"Total Income:    ${total_income:,.2f}")
    report_lines.append(f"Total Expenses:  ${total_expenses:,.2f}")
    report_lines.append(f"Balance:         ${balance:,.2f}")
    report_lines.append("")

    # Category breakdown
    category_summary = get_category_summary(tracker, 'expense', start_date, end_date)

    if not category_summary.empty:
        report_lines.append("EXPENSES BY CATEGORY")
        report_lines.append("-" * 60)

        for category, row in category_summary.iterrows():
            report_lines.append(
                f"{category:20s} ${row['total']:>10,.2f} ({row['percentage']:>5.1f}%) "
                f"[{int(row['count'])} transactions]"
            )

        report_lines.append("")

    # Top expenses
    top_expenses = get_top_expenses(tracker, 5, start_date, end_date)

    if not top_expenses.empty:
        report_lines.append("TOP 5 EXPENSES")
        report_lines.append("-" * 60)

        for idx, row in top_expenses.iterrows():
            date_str = row['date'].strftime('%Y-%m-%d')
            report_lines.append(
                f"{date_str} | {row['category']:15s} | ${row['amount']:>8,.2f} | {row['description']}"
            )

        report_lines.append("")

    report_lines.append("=" * 60)

    report_text = "\n".join(report_lines)

    # Save to file if specified
    if output_file:
        try:
            with open(output_file, 'w') as f:
                f.write(report_text)
            print(f"✓ Report saved to {output_file}")
        except Exception as e:
            print(f"✗ Error saving report: {e}")

    return report_text

print("Analytics and reporting implementation completed!")
Data Visualization with Matplotlib
Visualization transforms numerical data into intuitive charts enabling quick pattern recognition and insights. Using Matplotlib creates pie charts showing category proportions, bar charts comparing spending across categories, and line graphs tracking trends over time with customizable styling and labels making financial data immediately understandable.
# Data Visualization with Matplotlib

import matplotlib.pyplot as plt
import pandas as pd
from datetime import datetime
import numpy as np

# === Visualization functions ===

def plot_category_pie_chart(tracker, start_date=None, end_date=None,
                            transaction_type='expense', save_path=None):
    """
    Create pie chart of expenses by category.

    Args:
        tracker: ExpenseTracker instance
        start_date (str): Optional start date
        end_date (str): Optional end date
        transaction_type (str): 'expense' or 'income'
        save_path (str): Path to save chart
    """
    from expense_analytics import get_category_summary

    summary = get_category_summary(tracker, transaction_type, start_date, end_date)

    if summary.empty:
        print("No data to visualize")
        return

    # Create pie chart
    fig, ax = plt.subplots(figsize=(10, 8))

    colors = plt.cm.Set3(range(len(summary)))

    wedges, texts, autotexts = ax.pie(
        summary['total'],
        labels=summary.index,
        autopct='%1.1f%%',
        colors=colors,
        startangle=90,
        explode=[0.05] * len(summary)  # Slightly separate slices
    )

    # Customize text
    for text in texts:
        text.set_fontsize(10)

    for autotext in autotexts:
        autotext.set_color('white')
        autotext.set_fontweight('bold')
        autotext.set_fontsize(9)

    # Title
    period = f"{start_date} to {end_date}" if start_date and end_date else "All Time"
    ax.set_title(f"{transaction_type.title()} Distribution by Category\n{period}",
                 fontsize=14, fontweight='bold', pad=20)

    # Equal aspect ratio
    ax.axis('equal')

    plt.tight_layout()

    if save_path:
        plt.savefig(save_path, dpi=300, bbox_inches='tight')
        print(f"✓ Chart saved to {save_path}")

    plt.show()

def plot_category_bar_chart(tracker, start_date=None, end_date=None,
                           transaction_type='expense', save_path=None):
    """
    Create bar chart of expenses by category.

    Args:
        tracker: ExpenseTracker instance
        start_date (str): Optional start date
        end_date (str): Optional end date
        transaction_type (str): 'expense' or 'income'
        save_path (str): Path to save chart
    """
    from expense_analytics import get_category_summary

    summary = get_category_summary(tracker, transaction_type, start_date, end_date)

    if summary.empty:
        print("No data to visualize")
        return

    # Create bar chart
    fig, ax = plt.subplots(figsize=(12, 6))

    x_pos = np.arange(len(summary))

    bars = ax.bar(x_pos, summary['total'], color='skyblue', edgecolor='navy', linewidth=1.5)

    # Customize bars - color by height
    colors = plt.cm.Blues(np.linspace(0.4, 0.8, len(summary)))
    for bar, color in zip(bars, colors):
        bar.set_color(color)

    # Add value labels on bars
    for i, (bar, value) in enumerate(zip(bars, summary['total'])):
        height = bar.get_height()
        ax.text(bar.get_x() + bar.get_width()/2., height,
                f'${value:,.0f}',
                ha='center', va='bottom', fontsize=9, fontweight='bold')

    # Customize axes
    ax.set_xlabel('Category', fontsize=12, fontweight='bold')
    ax.set_ylabel('Amount ($)', fontsize=12, fontweight='bold')

    period = f"{start_date} to {end_date}" if start_date and end_date else "All Time"
    ax.set_title(f"{transaction_type.title()} by Category\n{period}",
                 fontsize=14, fontweight='bold', pad=20)

    ax.set_xticks(x_pos)
    ax.set_xticklabels(summary.index, rotation=45, ha='right')

    # Grid
    ax.yaxis.grid(True, linestyle='--', alpha=0.3)
    ax.set_axisbelow(True)

    plt.tight_layout()

    if save_path:
        plt.savefig(save_path, dpi=300, bbox_inches='tight')
        print(f"✓ Chart saved to {save_path}")

    plt.show()

def plot_monthly_trend(tracker, months=6, save_path=None):
    """
    Plot spending trend over months.

    Args:
        tracker: ExpenseTracker instance
        months (int): Number of months to show
        save_path (str): Path to save chart
    """
    from expense_analytics import get_monthly_summary

    # Get data for last N months
    end_date = datetime.now()
    monthly_data = []

    for i in range(months):
        date = end_date - pd.DateOffset(months=i)
        summary = get_monthly_summary(tracker, date.year, date.month)
        summary['month_label'] = date.strftime('%b %Y')
        monthly_data.append(summary)

    monthly_data.reverse()

    # Extract data
    labels = [d['month_label'] for d in monthly_data]
    expenses = [d['total_expenses'] for d in monthly_data]
    income = [d['total_income'] for d in monthly_data]

    # Create line chart
    fig, ax = plt.subplots(figsize=(12, 6))

    x_pos = np.arange(len(labels))

    # Plot lines
    ax.plot(x_pos, expenses, marker='o', linewidth=2.5,
            color='#FF6B6B', label='Expenses', markersize=8)
    ax.plot(x_pos, income, marker='s', linewidth=2.5,
            color='#4ECDC4', label='Income', markersize=8)

    # Fill area between lines
    ax.fill_between(x_pos, expenses, alpha=0.3, color='#FF6B6B')
    ax.fill_between(x_pos, income, alpha=0.3, color='#4ECDC4')

    # Customize axes
    ax.set_xlabel('Month', fontsize=12, fontweight='bold')
    ax.set_ylabel('Amount ($)', fontsize=12, fontweight='bold')
    ax.set_title('Income vs Expenses Trend', fontsize=14, fontweight='bold', pad=20)

    ax.set_xticks(x_pos)
    ax.set_xticklabels(labels, rotation=45, ha='right')

    # Grid and legend
    ax.grid(True, linestyle='--', alpha=0.3)
    ax.legend(loc='upper left', fontsize=10)

    # Format y-axis
    ax.yaxis.set_major_formatter(plt.FuncFormatter(lambda x, p: f'${x:,.0f}'))

    plt.tight_layout()

    if save_path:
        plt.savefig(save_path, dpi=300, bbox_inches='tight')
        print(f"✓ Chart saved to {save_path}")

    plt.show()

def create_dashboard(tracker, save_path=None):
    """
    Create comprehensive dashboard with multiple charts.

    Args:
        tracker: ExpenseTracker instance
        save_path (str): Path to save dashboard
    """
    from expense_analytics import get_category_summary, get_monthly_summary

    # Create figure with subplots
    fig = plt.figure(figsize=(16, 10))
    gs = fig.add_gridspec(2, 2, hspace=0.3, wspace=0.3)

    # 1. Category Pie Chart
    ax1 = fig.add_subplot(gs[0, 0])
    summary = get_category_summary(tracker, 'expense')
    if not summary.empty:
        ax1.pie(summary['total'], labels=summary.index, autopct='%1.1f%%',
                colors=plt.cm.Set3(range(len(summary))))
        ax1.set_title('Expense Distribution', fontweight='bold')

    # 2. Category Bar Chart
    ax2 = fig.add_subplot(gs[0, 1])
    if not summary.empty:
        summary_top = summary.head(5)
        ax2.barh(summary_top.index, summary_top['total'], color='skyblue')
        ax2.set_xlabel('Amount ($)')
        ax2.set_title('Top 5 Categories', fontweight='bold')
        ax2.invert_yaxis()

    # 3. Monthly Trend
    ax3 = fig.add_subplot(gs[1, :])
    monthly_data = []
    for i in range(6):
        date = datetime.now() - pd.DateOffset(months=i)
        summary = get_monthly_summary(tracker, date.year, date.month)
        summary['month_label'] = date.strftime('%b %Y')
        monthly_data.append(summary)
    monthly_data.reverse()

    labels = [d['month_label'] for d in monthly_data]
    expenses = [d['total_expenses'] for d in monthly_data]
    income = [d['total_income'] for d in monthly_data]

    x_pos = np.arange(len(labels))
    ax3.plot(x_pos, expenses, marker='o', label='Expenses', linewidth=2)
    ax3.plot(x_pos, income, marker='s', label='Income', linewidth=2)
    ax3.set_xticks(x_pos)
    ax3.set_xticklabels(labels, rotation=45, ha='right')
    ax3.set_ylabel('Amount ($)')
    ax3.set_title('6-Month Trend', fontweight='bold')
    ax3.legend()
    ax3.grid(True, alpha=0.3)

    fig.suptitle('Expense Tracker Dashboard', fontsize=16, fontweight='bold', y=0.98)

    if save_path:
        plt.savefig(save_path, dpi=300, bbox_inches='tight')
        print(f"✓ Dashboard saved to {save_path}")

    plt.show()

print("Data visualization implementation completed!")Financial Tracking Best Practices
- Record transactions immediately: Track expenses when they occur. Add descriptions for context. Include all transactions for accuracy
- Use consistent categories: Define standard categories upfront. Avoid creating too many categories. Group similar expenses together
- Validate input data: Check amounts are positive. Ensure dates are valid. Verify category exists before adding
- Back up data regularly: Save CSV files to cloud storage. Export data periodically. Maintain backup copies
- Review spending monthly: Generate monthly reports. Compare against previous months. Identify spending patterns and trends
- Set budget limits: Define spending limits by category. Track against budgets. Get alerts when approaching limits
- Use visualizations: Create charts for quick insights. Compare categories visually. Track trends with line graphs
- Handle recurring expenses: Track subscriptions separately. Set reminders for bills. Note due dates in descriptions
- Categorize accurately: Be consistent with categories. Split transactions when needed. Review uncategorized items regularly
- Export and analyze: Generate reports for tax preparation. Export to spreadsheets for detailed analysis. Share reports with financial advisors
Conclusion
Building expense tracker demonstrates practical data analysis and visualization applied to personal finance management. The project includes data management using Pandas with DataFrame structure organizing transactions, read_csv() and to_csv() for persistence, groupby() for aggregations, filtering with boolean indexing, date handling with to_datetime(), transaction operations implementing add_expense() recording spending, add_income() tracking earnings, delete_transaction() removing entries, view_transactions() displaying recent activity, and get_transactions_by_date_range() filtering periods, analytics functions computing get_total_expenses() and get_total_income(), calculating balance and savings, get_category_summary() breaking down by category with totals and percentages, get_monthly_summary() analyzing monthly patterns, get_top_expenses() identifying largest spending, and compare_months() tracking changes, and visualization capabilities creating pie charts showing category distribution with autopct labels, bar charts comparing spending with value labels, line graphs tracking income vs expenses trends, and comprehensive dashboards combining multiple charts.
Key learning outcomes include Pandas operations creating and manipulating DataFrames, reading and writing CSV files, filtering with boolean masks, grouping and aggregation functions, handling dates and time periods, data analysis computing descriptive statistics, calculating totals and averages, identifying patterns and trends, comparing time periods, Matplotlib visualization creating pie charts with autopct, customizing bar charts with colors and labels, plotting line graphs with markers, formatting axes and legends, adding grids and annotations, financial concepts tracking income and expenses, categorizing transactions, computing balances, analyzing spending patterns, budget monitoring, and user experience designing intuitive interfaces, validating user input, formatting output clearly, providing helpful error messages. Report generation includes creating summary statistics showing totals and averages, category breakdown with percentages, top expenses identification, monthly and yearly summaries, period comparisons tracking changes, and formatted text reports with proper alignment and headers. Best practices emphasize recording transactions immediately with descriptions, using consistent categories, validating input data thoroughly, backing up data regularly, reviewing spending monthly, setting budget limits by category, using visualizations for insights, handling recurring expenses properly, categorizing accurately and consistently, and exporting for tax preparation. Possible enhancements include adding budget alerts notifying when limits approached, implementing recurring transactions automation, creating mobile app with same backend, adding receipt scanning OCR integration, supporting multiple currencies with conversion, implementing data encryption for security, adding bank import CSV parsing, creating web dashboard with Flask or Django, implementing predictive analytics forecasting, and adding bill reminders with notifications. This project provides foundation for financial applications, data analysis systems, business intelligence tools, and personal finance management demonstrating how programming combined with data science creates powerful applications solving real-world problems enabling better financial decisions through data-driven insights making abstract transactions concrete and understandable through visualization and analysis.
$ share --platform
$ cat /comments/ (0)
$ cat /comments/
// No comments found. Be the first!