Debugging Python Code: Tools and Techniques
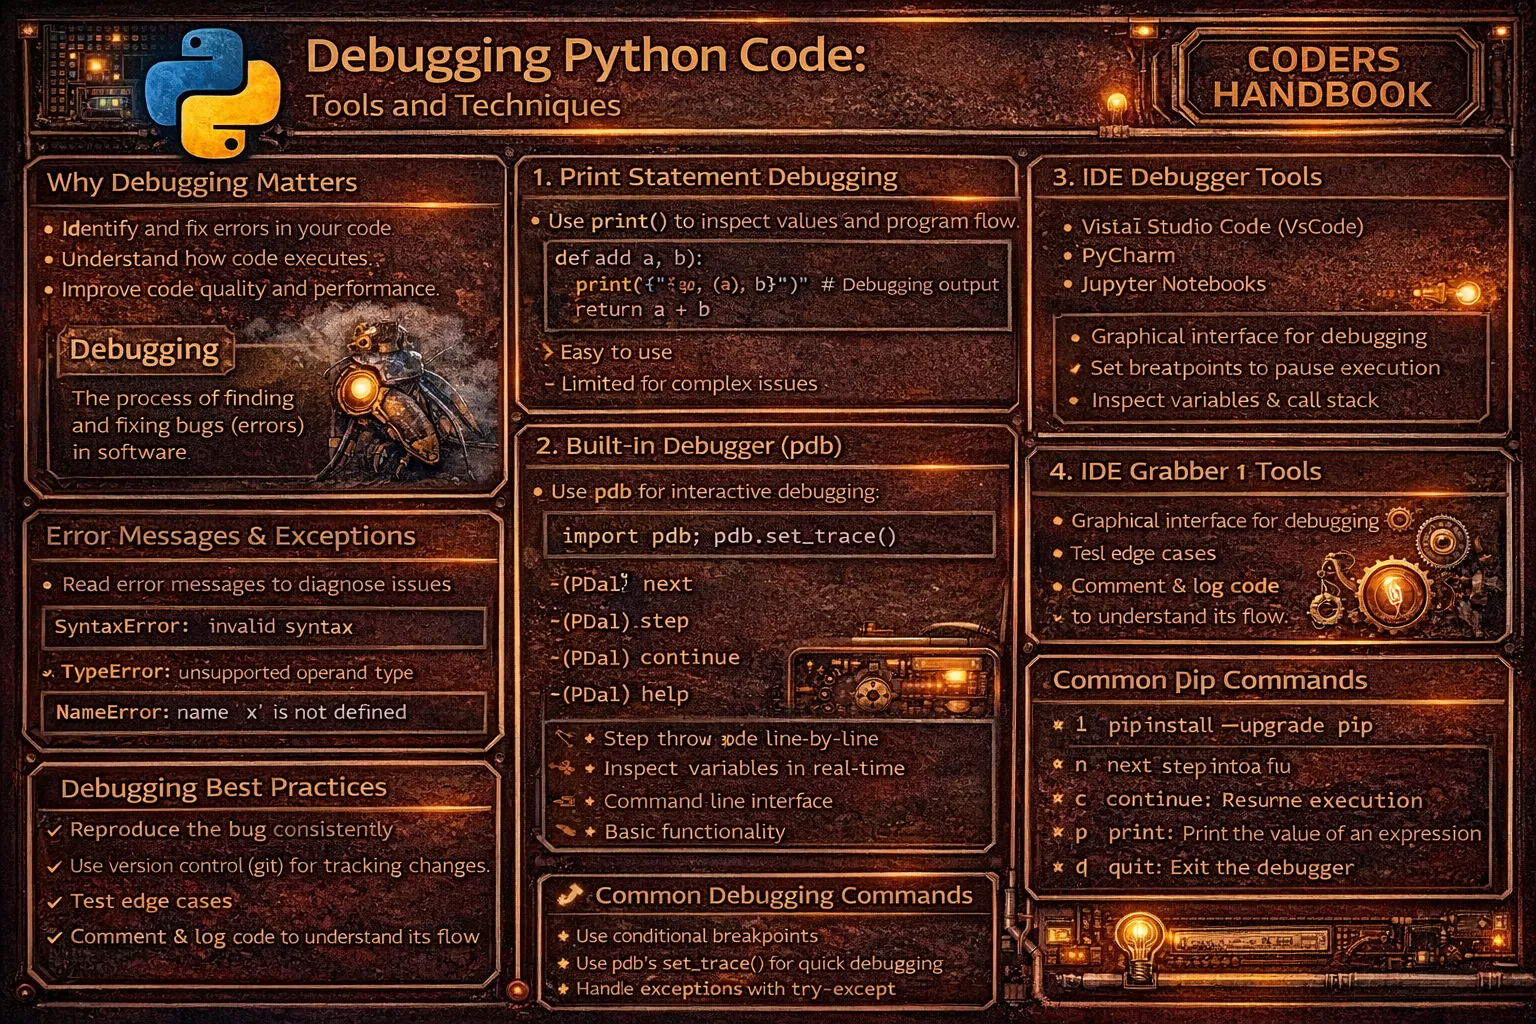
Debugging is the systematic process of identifying, isolating, and fixing errors in code through tools and techniques revealing program state, execution flow, and variable values at specific points. Python provides multiple debugging approaches ranging from simple print statements displaying variable values to sophisticated debuggers like pdb offering interactive code stepping, breakpoints pausing execution at specific lines, and stack inspection examining function call chains. Effective debugging combines strategic print statements for quick checks, the pdb debugger for interactive exploration, IDE debugging features providing visual breakpoints and variable watchers, the logging module for structured diagnostic output, and error tracking strategies systematically narrowing down bug locations through hypothesis testing and divide-and-conquer approaches.
This comprehensive guide explores print statement debugging displaying variable values and execution checkpoints with strategic placement principles, the pdb interactive debugger using set_trace() or breakpoint() to pause execution with commands like step, next, continue, list, print, and where for navigation and inspection, IDE debugging tools in PyCharm, VS Code, and other editors providing visual breakpoints, variable inspection panels, call stack viewers, and expression evaluation, the logging module creating structured diagnostic output with levels DEBUG, INFO, WARNING, ERROR, and CRITICAL enabling filtering and persistence, error tracking strategies including binary search debugging, rubber duck debugging explaining logic aloud, defensive assertions validating assumptions, exception handling with try-except blocks capturing error details, profiling identifying performance bottlenecks, and debugging best practices including reproducible test cases, version control for bisecting regressions, and systematic approaches avoiding random code changes. Whether you're tracking down logic errors producing incorrect results, investigating exceptions with cryptic stack traces, optimizing slow code sections, understanding complex code flow, validating assumptions about program state, or debugging production issues with limited reproduction steps, mastering Python debugging tools and techniques provides essential skills for efficient problem solving reducing debugging time from hours to minutes through systematic investigation.
Print Statement Debugging
Print statement debugging is the simplest approach displaying variable values, execution checkpoints, and conditional branches through strategically placed print() calls. While basic, print debugging effectively diagnoses simple bugs, verifies assumptions about program state, and traces execution flow through functions. Strategic placement at function entry and exit points, before and after critical operations, and inside conditional branches reveals where programs deviate from expected behavior.
# Print Statement Debugging

# === Basic print debugging ===

def calculate_total(prices, tax_rate):
    print(f"DEBUG: prices={prices}, tax_rate={tax_rate}")  # Input values

    subtotal = sum(prices)
    print(f"DEBUG: subtotal={subtotal}")  # Intermediate value

    tax = subtotal * tax_rate
    print(f"DEBUG: tax={tax}")  # Calculated tax

    total = subtotal + tax
    print(f"DEBUG: total={total}")  # Final result

    return total

result = calculate_total([10.0, 20.0, 30.0], 0.08)
print(f"Result: {result}")
# Output:
# DEBUG: prices=[10.0, 20.0, 30.0], tax_rate=0.08
# DEBUG: subtotal=60.0
# DEBUG: tax=4.8
# DEBUG: total=64.8
# Result: 64.8

# === Checkpoint debugging ===

def complex_process(data):
    print("[1] Starting process")

    filtered = [x for x in data if x > 0]
    print(f"[2] After filtering: {filtered}")

    sorted_data = sorted(filtered)
    print(f"[3] After sorting: {sorted_data}")

    result = sum(sorted_data) / len(sorted_data)
    print(f"[4] Final result: {result}")

    return result

# === Conditional debugging ===

def process_items(items):
    for i, item in enumerate(items):
        if item < 0:
            print(f"DEBUG: Negative value at index {i}: {item}")

        if i > 100:
            print(f"DEBUG: Processing item {i}")
            # Debug only after many iterations

# === Type and structure debugging ===

def debug_data_structure(data):
    print(f"Type: {type(data)}")
    print(f"Length: {len(data) if hasattr(data, '__len__') else 'N/A'}")
    print(f"Content: {data}")

    if isinstance(data, dict):
        print(f"Keys: {list(data.keys())}")
        print(f"Values: {list(data.values())}")

# === Function call tracing ===

def trace_call(func_name):
    print(f">>> Entering {func_name}")

def trace_return(func_name, result):
    print(f"<<< Exiting {func_name}, returning {result}")

def my_function(x, y):
    trace_call("my_function")
    result = x + y
    trace_return("my_function", result)
    return result

# === Pretty printing complex objects ===

import pprint

complex_data = {
    'users': [
        {'id': 1, 'name': 'Alice', 'scores': [85, 90, 88]},
        {'id': 2, 'name': 'Bob', 'scores': [92, 87, 91]}
    ],
    'metadata': {'version': '1.0', 'created': '2024-01-01'}
}

# Regular print (hard to read)
print(complex_data)

# Pretty print (formatted)
pprint.pprint(complex_data)
# Output:
# {'metadata': {'created': '2024-01-01', 'version': '1.0'},
#  'users': [{'id': 1, 'name': 'Alice', 'scores': [85, 90, 88]},
#            {'id': 2, 'name': 'Bob', 'scores': [92, 87, 91]}]}

# === Debugging with f-strings and expressions ===

x = 10
y = 20
print(f"x={x}, y={y}, x+y={x+y}, x*y={x*y}")

# Python 3.8+ f-string debug syntax
print(f"{x=}, {y=}, {x+y=}")
# Output: x=10, y=20, x+y=30

# === Conditional print debugging ===

DEBUG = True  # Set to False in production

def debug_print(*args, **kwargs):
    if DEBUG:
        print("[DEBUG]", *args, **kwargs)

def process_data(data):
    debug_print(f"Processing {len(data)} items")
    # Process data
    debug_print("Processing complete")

# === Limitations of print debugging ===

# Problem 1: Must remove before production
# Problem 2: No interactive inspection
# Problem 3: Clutters code with print statements
# Problem 4: Limited to what you print
# Problem 5: Doesn't work well for threading/async

# Better: Use logging module (see later section)The pdb Interactive Debugger
The pdb module provides Python's built-in interactive debugger enabling setting breakpoints, stepping through code line-by-line, inspecting variables, and evaluating expressions during execution. Using pdb.set_trace() or Python 3.7+ breakpoint() pauses program execution opening an interactive prompt where commands like step, next, continue, list, print, and where navigate code and inspect state. This interactive approach reveals program behavior dynamically without predicting what to print beforehand.
# The pdb Interactive Debugger

import pdb

# === Basic breakpoint insertion ===

def buggy_function(x, y):
    result = x + y
    pdb.set_trace()  # Execution pauses here
    return result * 2

# Python 3.7+ (recommended)
def modern_debug(x, y):
    result = x + y
    breakpoint()  # Cleaner syntax
    return result * 2

# === Running with pdb ===

# Run script with debugger from command line:
# python -m pdb script.py

# Automatically enter debugger on exception:
# python -m pdb -c continue script.py

# === Common pdb commands ===

# Navigation commands:
# l (list)      - Show current code location
# ll (longlist) - Show entire current function
# n (next)      - Execute next line (step over)
# s (step)      - Step into function calls
# r (return)    - Continue until function returns
# c (continue)  - Continue execution until next breakpoint
# q (quit)      - Exit debugger

# Inspection commands:
# p variable    - Print variable value
# pp variable   - Pretty-print variable
# a (args)      - Print function arguments
# w (where)     - Show stack trace
# u (up)        - Move up stack frame
# d (down)      - Move down stack frame

# Execution commands:
# !statement    - Execute Python statement
# cl (clear)    - Clear breakpoints
# h (help)      - Show help
# h command     - Help for specific command

# === Example debugging session ===

def calculate_average(numbers):
    total = sum(numbers)
    breakpoint()  # Pause here
    count = len(numbers)
    average = total / count
    return average

result = calculate_average([10, 20, 30])

# When breakpoint() is hit:
# > /path/to/file.py(4)calculate_average()
# -> count = len(numbers)
# (Pdb) p numbers
# [10, 20, 30]
# (Pdb) p total
# 60
# (Pdb) n  # Execute next line
# > /path/to/file.py(5)calculate_average()
# -> average = total / count
# (Pdb) p count
# 3
# (Pdb) c  # Continue execution

# === Conditional breakpoints ===

def process_items(items):
    for i, item in enumerate(items):
        # Break only on specific condition
        if item < 0:
            breakpoint()
        process(item)

# === Post-mortem debugging ===

import sys

def function_with_error():
    x = 10
    y = 0
    result = x / y  # ZeroDivisionError

try:
    function_with_error()
except:
    import pdb
    pdb.post_mortem()  # Debug at exception point

# Or use pm() in interactive Python:
# >>> function_with_error()
# Traceback...
# >>> import pdb; pdb.pm()

# === Setting breakpoints programmatically ===

import pdb

def complex_function():
    pdb.set_trace()  # Always breaks

    # Conditional breakpoint
    if some_condition:
        pdb.set_trace()

    # Break after N iterations
    for i in range(100):
        if i == 50:
            pdb.set_trace()

# === Using pdb.run() ===

import pdb

# Debug statement execution
pdb.run('function_to_debug(arg1, arg2)')

# Debug with custom globals/locals
pdb.run('function_to_debug()', globals(), locals())

# === Debugging with context ===

def debug_with_context():
    local_var = 42

    breakpoint()
    # At prompt, can inspect local_var:
    # (Pdb) p local_var
    # 42
    # (Pdb) p locals()
    # {'local_var': 42}
    # (Pdb) p globals().keys()
    # dict_keys([...])

# === Alternative: ipdb (IPython debugger) ===

# Install: pip install ipdb
# import ipdb; ipdb.set_trace()

# Features:
# - Tab completion
# - Syntax highlighting
# - Better introspection
# - More user-friendly

# === Environment variable control ===

# Disable breakpoint() globally:
# export PYTHONBREAKPOINT=0
# python script.py  # breakpoint() does nothing

# Use different debugger:
# export PYTHONBREAKPOINT=ipdb.set_trace
# python script.py  # Uses ipdb instead

# === Best practices ===

# 1. Use breakpoint() over pdb.set_trace() (Python 3.7+)
# 2. Remove breakpoints before committing
# 3. Use conditional breakpoints for loops
# 4. Learn common commands (n, s, c, p, l)
# 5. Use post-mortem debugging for exceptions
# 6. Consider ipdb for better experiencel (list code), n (next line), s (step into), p variable (print), c (continue). These cover 90% of debugging needs.IDE Debugging Tools
Modern IDEs like PyCharm, VS Code, and others provide visual debugging interfaces with graphical breakpoints, variable inspection panels, expression watchers, and call stack viewers. These tools offer pdb's power with better usability through point-and-click breakpoints, real-time variable displays updating as code executes, and integrated debugging workflows launching applications with debuggers attached. IDE debugging particularly shines for complex applications with multiple modules and lengthy execution paths.
# IDE Debugging Tools

# === PyCharm Debugging ===

# 1. Setting breakpoints:
#    - Click left gutter next to line number
#    - Red dot appears
#    - Or: Right-click line → Debug → Toggle Breakpoint

# 2. Running with debugger:
#    - Right-click file → Debug 'filename'
#    - Or: Click bug icon in toolbar
#    - Or: Shift+F9

# 3. Debug panel features:
#    - Variables: Shows all local/global variables
#    - Watches: Track specific expressions
#    - Frames: Navigate call stack
#    - Console: Execute Python during debugging

# 4. Debugging controls:
#    - F8: Step Over (next line)
#    - F7: Step Into (enter function)
#    - Shift+F8: Step Out (exit function)
#    - F9: Resume Program
#    - Ctrl+F8: Toggle Breakpoint

# 5. Conditional breakpoints:
#    - Right-click breakpoint → Edit
#    - Add condition: i > 50
#    - Breakpoint only triggers when condition true

# 6. Exception breakpoints:
#    - Run → View Breakpoints
#    - Click + → Python Exception Breakpoints
#    - Choose exception type (e.g., ValueError)
#    - Debugger pauses when exception raised

# === VS Code Debugging ===

# 1. Setting breakpoints:
#    - Click left gutter (red dot)
#    - Or: F9 on current line

# 2. Launch configuration (.vscode/launch.json):
{
    "version": "0.2.0",
    "configurations": [
        {
            "name": "Python: Current File",
            "type": "python",
            "request": "launch",
            "program": "${file}",
            "console": "integratedTerminal",
            "justMyCode": false  # Debug into libraries
        },
        {
            "name": "Python: Django",
            "type": "python",
            "request": "launch",
            "program": "${workspaceFolder}/manage.py",
            "args": ["runserver"],
            "django": true
        }
    ]
}

# 3. Debug controls:
#    - F5: Start/Continue
#    - F10: Step Over
#    - F11: Step Into
#    - Shift+F11: Step Out
#    - Ctrl+Shift+F5: Restart
#    - Shift+F5: Stop

# 4. Debug sidebar features:
#    - Variables panel
#    - Watch expressions
#    - Call stack
#    - Breakpoints list
#    - Debug console

# 5. Logpoints (non-breaking breakpoints):
#    - Right-click gutter → Add Logpoint
#    - Enter message: Value of x: {x}
#    - Logs message without stopping

# === Debugging Flask applications ===

# PyCharm:
# 1. Create Flask run configuration
# 2. Set breakpoints in route handlers
# 3. Debug → Run with debugger
# 4. Make request to endpoint
# 5. Debugger pauses at breakpoint

from flask import Flask
app = Flask(__name__)

@app.route('/user/<user_id>')
def get_user(user_id):
    # Set breakpoint here in IDE
    user = fetch_user(user_id)
    # Inspect 'user' in Variables panel
    return user

# === Debugging Django applications ===

# VS Code launch.json for Django:
{
    "name": "Django",
    "type": "python",
    "request": "launch",
    "program": "${workspaceFolder}/manage.py",
    "args": [
        "runserver",
        "--noreload"  # Important for debugging
    ],
    "django": true
}

# Set breakpoint in view:
def user_detail(request, user_id):
    # Breakpoint here
    user = User.objects.get(id=user_id)
    # Inspect user object
    return render(request, 'user.html', {'user': user})

# === Remote debugging ===

# PyCharm Professional:
# 1. Run → Edit Configurations → Add Python Remote Debug
# 2. Set host and port
# 3. Add to remote code:
import pydevd_pycharm
pydevd_pycharm.settrace('localhost', port=12345,
                         stdoutToServer=True,
                         stderrToServer=True)

# VS Code:
# 1. Install debugpy: pip install debugpy
# 2. Add to remote code:
import debugpy
debugpy.listen(5678)
print("Waiting for debugger...")
debugpy.wait_for_client()

# 3. VS Code launch.json:
{
    "name": "Attach to Remote",
    "type": "python",
    "request": "attach",
    "connect": {
        "host": "remote-server",
        "port": 5678
    }
}

# === Debugging tests ===

# PyCharm: Right-click test → Debug
# VS Code: Click debug icon above test function

import pytest

def test_calculation():
    result = complex_calculation(10, 20)
    # Set breakpoint here
    assert result == 30

# === Multi-threaded debugging ===

import threading

def worker(n):
    # Set breakpoint here
    result = expensive_operation(n)
    return result

threads = []
for i in range(5):
    t = threading.Thread(target=worker, args=(i,))
    threads.append(t)
    t.start()

# IDE shows all threads in Threads panel
# Can switch between thread stacks

# === Best IDE debugging practices ===

# 1. Use conditional breakpoints for loops
# 2. Set exception breakpoints for debugging crashes
# 3. Use "Step Out" to exit long functions quickly
# 4. Watch expressions to track complex calculations
# 5. Use logpoints to avoid removing debug code
# 6. Learn keyboard shortcuts (faster than mouse)
# 7. Use "justMyCode": false to debug libraries
# 8. Configure logging to see alongside debugging
The Logging Module
The logging module provides structured diagnostic output with configurable severity levels, formatters, handlers, and filters, superior to print statements for production debugging. Logging levels DEBUG, INFO, WARNING, ERROR, and CRITICAL enable filtering output by importance, with handlers directing logs to files, console, or external services. Unlike print statements requiring manual removal, logging can be configured at runtime enabling verbose debugging in development and minimal production logging without code changes.
# The Logging Module

import logging

# === Basic logging setup ===

# Simple configuration
logging.basicConfig(
    level=logging.DEBUG,
    format='%(asctime)s - %(name)s - %(levelname)s - %(message)s'
)

logger = logging.getLogger(__name__)

# === Logging levels (increasing severity) ===

logger.debug("Detailed information for diagnosing problems")
logger.info("General information about program execution")
logger.warning("Warning about potential issues")
logger.error("Error that occurred but program continues")
logger.critical("Critical error, program may not continue")

# Output:
# 2024-03-15 10:30:45,123 - __main__ - DEBUG - Detailed information...
# 2024-03-15 10:30:45,124 - __main__ - INFO - General information...
# 2024-03-15 10:30:45,125 - __main__ - WARNING - Warning about...
# 2024-03-15 10:30:45,126 - __main__ - ERROR - Error that occurred...
# 2024-03-15 10:30:45,127 - __main__ - CRITICAL - Critical error...

# === Logging in functions ===

logger = logging.getLogger(__name__)

def calculate_total(items):
    logger.debug(f"Calculating total for {len(items)} items")

    if not items:
        logger.warning("Empty items list provided")
        return 0

    total = sum(items)
    logger.info(f"Total calculated: {total}")
    return total

# === Advanced configuration ===

import logging.config

LOGGING_CONFIG = {
    'version': 1,
    'disable_existing_loggers': False,
    'formatters': {
        'detailed': {
            'format': '%(asctime)s - %(name)s - %(levelname)s - %(funcName)s:%(lineno)d - %(message)s'
        },
        'simple': {
            'format': '%(levelname)s - %(message)s'
        }
    },
    'handlers': {
        'console': {
            'class': 'logging.StreamHandler',
            'level': 'DEBUG',
            'formatter': 'simple',
            'stream': 'ext://sys.stdout'
        },
        'file': {
            'class': 'logging.FileHandler',
            'level': 'DEBUG',
            'formatter': 'detailed',
            'filename': 'app.log',
            'mode': 'a'
        }
    },
    'loggers': {
        '': {  # Root logger
            'handlers': ['console', 'file'],
            'level': 'DEBUG'
        }
    }
}

logging.config.dictConfig(LOGGING_CONFIG)

# === File logging with rotation ===

from logging.handlers import RotatingFileHandler

logger = logging.getLogger(__name__)

# Rotate when file reaches 10MB, keep 5 backups
handler = RotatingFileHandler(
    'app.log',
    maxBytes=10*1024*1024,  # 10MB
    backupCount=5
)
handler.setFormatter(
    logging.Formatter('%(asctime)s - %(levelname)s - %(message)s')
)
logger.addHandler(handler)
logger.setLevel(logging.DEBUG)

# === Time-based rotation ===

from logging.handlers import TimedRotatingFileHandler

# Rotate daily, keep 30 days
handler = TimedRotatingFileHandler(
    'app.log',
    when='midnight',
    interval=1,
    backupCount=30
)

# === Logging exceptions ===

logger = logging.getLogger(__name__)

try:
    result = 10 / 0
except ZeroDivisionError:
    logger.error("Division by zero occurred", exc_info=True)
    # Or:
    logger.exception("Division by zero occurred")  # Automatically includes traceback

# Output includes full stack trace

# === Structured logging ===

import json

class JsonFormatter(logging.Formatter):
    def format(self, record):
        log_data = {
            'timestamp': self.formatTime(record),
            'level': record.levelname,
            'message': record.getMessage(),
            'module': record.module,
            'function': record.funcName,
            'line': record.lineno
        }
        if record.exc_info:
            log_data['exception'] = self.formatException(record.exc_info)
        return json.dumps(log_data)

handler = logging.StreamHandler()
handler.setFormatter(JsonFormatter())
logger.addHandler(handler)

# === Context logging ===

import logging

logger = logging.getLogger(__name__)

def process_user(user_id):
    # Add context to all logs in this function
    logger = logging.LoggerAdapter(
        logging.getLogger(__name__),
        {'user_id': user_id}
    )

    logger.info("Processing user")
    # Output: INFO - Processing user [user_id=123]

# === Performance debugging with logging ===

import time
import logging

logger = logging.getLogger(__name__)

def expensive_operation():
    start = time.time()
    logger.debug("Starting expensive operation")

    # Do work
    time.sleep(1)

    elapsed = time.time() - start
    logger.info(f"Operation completed in {elapsed:.2f}s")

# === Debugging SQL queries ===

# Django:
LOGGING = {
    'version': 1,
    'handlers': {
        'console': {
            'class': 'logging.StreamHandler',
        },
    },
    'loggers': {
        'django.db.backends': {
            'level': 'DEBUG',
            'handlers': ['console'],
        },
    },
}

# SQLAlchemy:
import logging
logging.basicConfig()
logging.getLogger('sqlalchemy.engine').setLevel(logging.INFO)

# === Environment-based configuration ===

import os
import logging

ENV = os.getenv('ENVIRONMENT', 'development')

if ENV == 'production':
    logging.basicConfig(level=logging.WARNING)
else:
    logging.basicConfig(level=logging.DEBUG)
Debugging Best Practices
- Reproduce bugs consistently: Create minimal reproducible examples isolating bugs from surrounding code. Consistent reproduction enables systematic debugging and verification of fixes
- Use logging over print: Replace print statements with logging module using appropriate levels. Logging persists, filters by severity, and doesn't require removal for production
- Read error messages carefully: Stack traces contain valuable information about error location, type, and cause. Read from bottom up identifying exact line causing issues
- Binary search debugging: For bugs in large code sections, comment out half the code. If bug disappears, it's in commented section. Repeat narrowing location exponentially
- Check assumptions with assertions: Use
assertstatements validating assumptions about variable types, values, and state. Assertions fail fast revealing incorrect assumptions - Use version control bisecting: When bugs appear after changes, use
git bisectto binary search commits identifying when bugs were introduced - Debug with tests: Write failing tests reproducing bugs before fixing. Tests verify fixes and prevent regression ensuring bugs don't return
- Explain code aloud (rubber duck): Explaining logic to rubber duck, colleague, or yourself often reveals flaws in reasoning or missed edge cases
- Take breaks when stuck: Stepping away from difficult bugs provides fresh perspective. Often solutions appear obvious after breaks when mental fatigue clears
- Document bugs and fixes: Write comments or commit messages explaining why bugs occurred and how fixes work. Future developers (including yourself) benefit from context
Conclusion
Debugging Python code effectively combines multiple tools and techniques from simple print statements displaying variable values at strategic checkpoints to sophisticated interactive debuggers providing step-by-step execution control. Print debugging offers quick diagnostic capability through strategically placed print() calls showing values, types, and execution flow, though requiring manual removal before production and providing limited interactivity. The pdb interactive debugger enables pausing execution with set_trace() or breakpoint(), stepping through code with next and step commands, inspecting variables with print, navigating call stacks with where and up/down, and evaluating expressions dynamically revealing program state without predicting inspection needs beforehand.
IDE debugging tools in PyCharm, VS Code, and similar editors provide visual debugging interfaces with point-and-click breakpoints, variable inspection panels updating in real-time, expression watchers tracking complex calculations, call stack viewers navigating function chains, and conditional breakpoints triggering only when specific conditions hold. The logging module creates structured diagnostic output superior to print statements through configurable severity levels DEBUG, INFO, WARNING, ERROR, and CRITICAL enabling filtering, formatters customizing output appearance, handlers directing logs to files or console with rotation, and runtime configuration enabling verbose debugging in development and minimal production logging without code changes. Best practices emphasize reproducing bugs consistently creating minimal examples, using logging over print for persistent diagnostics, reading error messages and stack traces carefully, binary search debugging halving code sections systematically, checking assumptions with assertions failing fast, using version control bisecting to identify regression commits, debugging with tests verifying fixes prevent regression, explaining logic aloud revealing reasoning flaws, taking breaks when stuck gaining fresh perspective, and documenting bugs and fixes providing future context. By mastering print debugging for quick checks, pdb for interactive exploration, IDE tools for visual debugging, logging for structured output, and systematic debugging strategies including hypothesis testing and divide-and-conquer approaches, you gain essential skills for efficient problem solving reducing debugging time from hours to minutes through methodical investigation, proper tool selection, and systematic approaches avoiding random code changes in professional Python development.
$ share --platform
$ cat /comments/ (0)
$ cat /comments/
// No comments found. Be the first!