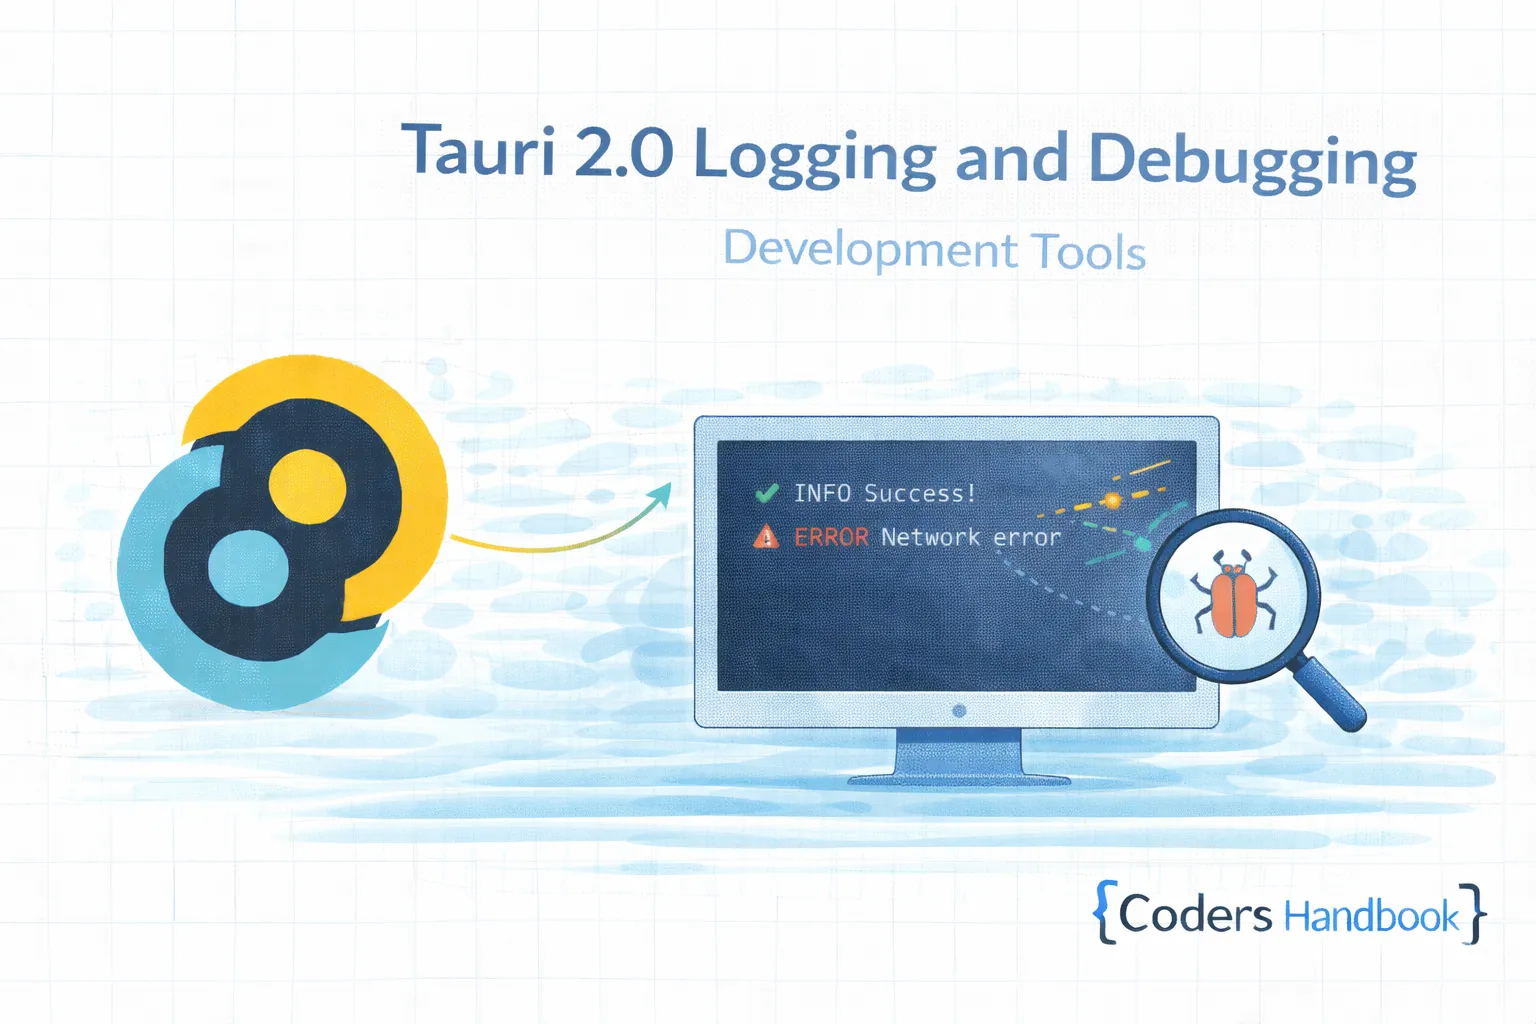
Tauri 2.0 Logging and Debugging Development Tools
Logging and debugging in Tauri 2.0 provide essential development tools for tracking application behavior, diagnosing issues, and monitoring runtime state combining Rust backend logging with frontend debugging enabling comprehensive troubleshooting across entire application stack—critical functionality for development, testing, and production monitoring maintaining visibility into application operations catching errors early and resolving issues efficiently. Logging system combines structured Rust logging with configurable log levels and filtering, frontend console integration bridging JavaScript and Rust logs, DevTools access for web debugging, error tracking with stack traces, performance monitoring with timing measurements, and production logging writing to files for post-deployment diagnostics delivering complete observability solution. This comprehensive guide covers understanding logging architecture and best practices, implementing Rust backend logging with tracing crate, configuring log levels and output targets, integrating frontend console with backend logs, using Chrome DevTools for debugging, implementing error tracking with context, building structured logging with metadata, creating log file rotation preventing disk space issues, and real-world examples including debug dashboard showing live logs, error reporter with crash handling, and performance profiler with metrics tracking maintaining comprehensive visibility into application behavior through proper logging infrastructure. Mastering logging patterns enables building professional desktop applications with robust debugging capabilities maintaining efficient troubleshooting and production monitoring. Before proceeding, understand commands and event handling.
Rust Backend Logging Setup
Rust logging uses tracing and log crates providing structured logging with levels, filters, and formatting. Understanding backend logging enables tracking Rust operations maintaining visibility into command execution, errors, and performance throughout backend logic.
// Cargo.toml dependencies
[dependencies]
tauri = { version = "2.0", features = ["shell-open"] }
log = "0.4"
env_logger = "0.11"
tracing = "0.1"
tracing-subscriber = { version = "0.3", features = ["env-filter"] }

// src-tauri/src/main.rs - Initialize logging
use tracing_subscriber::{fmt, prelude::*, EnvFilter};

fn main() {
    // Initialize tracing subscriber with environment filter
    tracing_subscriber::registry()
        .with(fmt::layer())
        .with(EnvFilter::from_default_env()
            .add_directive("tauri=debug".parse().unwrap())
            .add_directive("my_app=trace".parse().unwrap()))
        .init();

    tauri::Builder::default()
        .setup(|app| {
            tracing::info!("Application starting...");
            Ok(())
        })
        .invoke_handler(tauri::generate_handler![
            log_test,
            process_data,
        ])
        .run(tauri::generate_context!())
        .expect("error while running tauri application");
}

// Using different log levels
use tracing::{trace, debug, info, warn, error};

#[tauri::command]
async fn log_test() -> Result<String, String> {
    trace!("This is a trace message - very detailed");
    debug!("This is a debug message - development info");
    info!("This is an info message - general information");
    warn!("This is a warning message - potential issues");
    error!("This is an error message - something went wrong");

    Ok("Logged all levels".to_string())
}

// Structured logging with fields
#[tauri::command]
async fn process_data(data: String, user_id: i32) -> Result<(), String> {
    info!(
        user_id = user_id,
        data_length = data.len(),
        "Processing user data"
    );

    // Simulate processing
    match validate_data(&data) {
        Ok(_) => {
            info!(user_id = user_id, "Data validation successful");
            Ok(())
        }
        Err(e) => {
            error!(
                user_id = user_id,
                error = %e,
                "Data validation failed"
            );
            Err(e.to_string())
        }
    }
}

fn validate_data(data: &str) -> Result<(), Box<dyn std::error::Error>> {
    if data.is_empty() {
        return Err("Data is empty".into());
    }
    Ok(())
}

// Logging with spans (for tracking operations)
use tracing::{instrument, Span};

#[instrument(name = "fetch_user", skip(db))]
async fn fetch_user(db: &Database, user_id: i32) -> Result<User, Error> {
    debug!("Fetching user from database");

    let user = db.query_user(user_id).await?;

    info!(username = %user.name, "User fetched successfully");
    Ok(user)
}

// Performance timing
use std::time::Instant;

#[tauri::command]
async fn expensive_operation() -> Result<String, String> {
    let start = Instant::now();
    info!("Starting expensive operation");

    // Simulate work
    std::thread::sleep(std::time::Duration::from_millis(100));

    let duration = start.elapsed();
    info!(
        duration_ms = duration.as_millis(),
        "Expensive operation completed"
    );

    Ok(format!("Completed in {}ms", duration.as_millis()))
}

// Custom log formatting
use tracing_subscriber::fmt::format::FmtSpan;

fn init_logging_with_custom_format() {
    tracing_subscriber::fmt()
        .with_max_level(tracing::Level::DEBUG)
        .with_target(false)
        .with_thread_ids(true)
        .with_span_events(FmtSpan::CLOSE)
        .with_file(true)
        .with_line_number(true)
        .init();
}

// Environment-based log level
// Set via: RUST_LOG=debug cargo tauri dev
// Or in .env: RUST_LOG=my_app=trace,tauri=debug

// File logging
use tracing_subscriber::fmt::writer::MakeWriter;
use std::fs::OpenOptions;
use std::io;

struct FileWriter;

impl MakeWriter<'_> for FileWriter {
    type Writer = std::fs::File;

    fn make_writer(&self) -> Self::Writer {
        OpenOptions::new()
            .create(true)
            .append(true)
            .open("app.log")
            .expect("Unable to open log file")
    }
}

fn init_file_logging() {
    tracing_subscriber::fmt()
        .with_writer(FileWriter)
        .init();
}
Frontend Logging and Console Integration
Frontend logging uses browser console and custom loggers. Understanding JavaScript logging enables tracking UI events, user interactions, and state changes coordinating with backend logs maintaining complete application visibility.
// Frontend logging utility
class Logger {
  private context: string;
  private enableTrace: boolean;

  constructor(context: string, enableTrace = true) {
    this.context = context;
    this.enableTrace = enableTrace;
  }

  trace(message: string, ...args: any[]) {
    if (this.enableTrace) {
      console.trace(`[${this.context}] ${message}`, ...args);
    }
  }

  debug(message: string, ...args: any[]) {
    console.debug(`[${this.context}] ${message}`, ...args);
  }

  info(message: string, ...args: any[]) {
    console.info(`[${this.context}] ${message}`, ...args);
  }

  warn(message: string, ...args: any[]) {
    console.warn(`[${this.context}] ${message}`, ...args);
  }

  error(message: string, error?: Error | unknown) {
    console.error(`[${this.context}] ${message}`, error);

    // Optionally send to backend for logging
    if (error instanceof Error) {
      this.reportError(message, error);
    }
  }

  async reportError(message: string, error: Error) {
    try {
      await invoke('log_frontend_error', {
        context: this.context,
        message,
        error: error.message,
        stack: error.stack,
      });
    } catch (e) {
      console.error('Failed to report error to backend:', e);
    }
  }

  group(label: string) {
    console.group(`[${this.context}] ${label}`);
  }

  groupEnd() {
    console.groupEnd();
  }

  time(label: string) {
    console.time(`[${this.context}] ${label}`);
  }

  timeEnd(label: string) {
    console.timeEnd(`[${this.context}] ${label}`);
  }
}

// Usage
import { invoke } from '@tauri-apps/api/core';

const logger = new Logger('MyComponent');

logger.info('Component initialized');
logger.debug('Loading data...', { userId: 123 });
logger.warn('Slow network detected');
logger.error('Failed to load', new Error('Network error'));

// Performance timing
logger.time('DataFetch');
await fetchData();
logger.timeEnd('DataFetch');

// Grouped logs
logger.group('User Actions');
logger.info('User clicked button');
logger.info('Form submitted');
logger.groupEnd();

// React hook for logging
import { useEffect, useRef } from 'react';

function useLogger(componentName: string) {
  const logger = useRef(new Logger(componentName));

  useEffect(() => {
    logger.current.info('Component mounted');
    return () => {
      logger.current.info('Component unmounted');
    };
  }, []);

  return logger.current;
}

// Usage in component
function MyComponent() {
  const logger = useLogger('MyComponent');

  const handleClick = () => {
    logger.debug('Button clicked');
  };

  return <button onClick={handleClick}>Click me</button>;
}

// Enhanced logger with log levels
enum LogLevel {
  TRACE = 0,
  DEBUG = 1,
  INFO = 2,
  WARN = 3,
  ERROR = 4,
}

class EnhancedLogger {
  private minLevel: LogLevel;

  constructor(minLevel: LogLevel = LogLevel.DEBUG) {
    this.minLevel = minLevel;
  }

  private shouldLog(level: LogLevel): boolean {
    return level >= this.minLevel;
  }

  trace(message: string, data?: any) {
    if (this.shouldLog(LogLevel.TRACE)) {
      console.trace(message, data);
    }
  }

  debug(message: string, data?: any) {
    if (this.shouldLog(LogLevel.DEBUG)) {
      console.debug(message, data);
    }
  }

  info(message: string, data?: any) {
    if (this.shouldLog(LogLevel.INFO)) {
      console.info(message, data);
    }
  }

  warn(message: string, data?: any) {
    if (this.shouldLog(LogLevel.WARN)) {
      console.warn(message, data);
    }
  }

  error(message: string, error?: unknown) {
    if (this.shouldLog(LogLevel.ERROR)) {
      console.error(message, error);
    }
  }
}

// Production logger (only errors and warnings)
const prodLogger = new EnhancedLogger(LogLevel.WARN);

// Development logger (all levels)
const devLogger = new EnhancedLogger(LogLevel.TRACE);

// Rust command to receive frontend logs
#[tauri::command]
async fn log_frontend_error(
    context: String,
    message: String,
    error: String,
    stack: Option<String>,
) -> Result<(), String> {
    error!(
        context = %context,
        message = %message,
        error = %error,
        stack = ?stack,
        "Frontend error received"
    );
    Ok(())
}
Chrome DevTools Integration
Chrome DevTools provide powerful debugging capabilities for Tauri frontend. Understanding DevTools usage enables inspecting DOM, debugging JavaScript, monitoring network requests, and profiling performance maintaining efficient development workflow.
// Enable DevTools in development
// src-tauri/tauri.conf.json
{
  "build": {
    "devPath": "http://localhost:5173",
    "beforeDevCommand": "npm run dev"
  },
  "tauri": {
    "windows": [
      {
        "devTools": true  // Enable DevTools in development
      }
    ]
  }
}

// Open DevTools programmatically
import { Window } from '@tauri-apps/api/window';

async function openDevTools() {
  const window = Window.getCurrent();
  await window.openDevTools();
}

// Close DevTools
async function closeDevTools() {
  const window = Window.getCurrent();
  await window.closeDevTools();
}

// Check if DevTools is open
async function isDevToolsOpen() {
  const window = Window.getCurrent();
  return await window.isDevToolsOpen();
}

// Debug component with DevTools
import React, { useEffect } from 'react';

function DebugPanel() {
  useEffect(() => {
    // Log component lifecycle
    console.log('%c Component Mounted', 'color: green; font-weight: bold');

    // Styled console output
    console.log(
      '%c Debug Info',
      'background: #222; color: #bada55; padding: 5px;',
      { timestamp: Date.now() }
    );

    return () => {
      console.log('%c Component Unmounted', 'color: red; font-weight: bold');
    };
  }, []);

  return <div>Debug Panel</div>;
}

// Keyboard shortcut for DevTools
useEffect(() => {
  const handleKeyPress = async (e: KeyboardEvent) => {
    // Ctrl+Shift+I or Cmd+Opt+I to toggle DevTools
    if ((e.ctrlKey || e.metaKey) && e.shiftKey && e.key === 'I') {
      e.preventDefault();
      const isOpen = await isDevToolsOpen();
      if (isOpen) {
        await closeDevTools();
      } else {
        await openDevTools();
      }
    }
  };

  window.addEventListener('keydown', handleKeyPress);
  return () => window.removeEventListener('keydown', handleKeyPress);
}, []);

// Console table for structured data
function logUserData(users: User[]) {
  console.table(users, ['id', 'name', 'email']);
}

// Performance markers
performance.mark('operation-start');
await performOperation();
performance.mark('operation-end');
performance.measure('operation', 'operation-start', 'operation-end');

const measure = performance.getEntriesByName('operation')[0];
console.log(`Operation took ${measure.duration}ms`);

// Memory profiling
if (performance.memory) {
  console.log('Memory usage:', {
    used: `${(performance.memory.usedJSHeapSize / 1048576).toFixed(2)} MB`,
    total: `${(performance.memory.totalJSHeapSize / 1048576).toFixed(2)} MB`,
    limit: `${(performance.memory.jsHeapSizeLimit / 1048576).toFixed(2)} MB`,
  });
}
Log Levels and Filtering
| Level | Usage | Example | When to Use |
|---|---|---|---|
| TRACE | Very detailed | Function entry/exit | Deep debugging only |
| DEBUG | Development info | Variable values | Development builds |
| INFO | General events | User logged in | Normal operations |
| WARN | Potential issues | Deprecated API used | Non-critical problems |
| ERROR | Failures | Database connection failed | Critical errors |
Production Logging to Files
Production logging writes to files enabling post-deployment diagnostics. Understanding file logging enables tracking production issues through persistent logs with rotation preventing disk space exhaustion maintaining long-term application monitoring.
// Production logging with file rotation
// Cargo.toml
[dependencies]
tracing-appender = "0.2"

// src-tauri/src/main.rs
use tracing_appender::rolling::{RollingFileAppender, Rotation};
use tracing_subscriber::fmt::writer::MakeWriterExt;

fn init_production_logging() {
    let file_appender = RollingFileAppender::new(
        Rotation::DAILY,     // Rotate daily
        "logs",              // Directory
        "app.log"            // File prefix
    );

    tracing_subscriber::fmt()
        .with_writer(file_appender)
        .with_ansi(false)    // No color codes in files
        .with_max_level(tracing::Level::INFO)
        .init();
}

// Multiple outputs (console + file)
fn init_multi_output_logging() {
    let file_appender = RollingFileAppender::new(
        Rotation::DAILY,
        "logs",
        "app.log",
    );

    let (non_blocking, _guard) = tracing_appender::non_blocking(file_appender);

    tracing_subscriber::fmt()
        .with_writer(
            std::io::stdout
                .and(non_blocking)
        )
        .init();
}

// Log rotation sizes
use tracing_appender::rolling::Rotation;

let daily = Rotation::DAILY;       // New file each day
let hourly = Rotation::HOURLY;     // New file each hour
let minutely = Rotation::MINUTELY; // New file each minute
let never = Rotation::NEVER;       // Single file

// Custom log file path
use tauri::api::path::app_log_dir;

#[tauri::command]
async fn init_app_logging(config: tauri::Config) -> Result<(), String> {
    let log_dir = app_log_dir(&config)
        .ok_or("Could not determine log directory")?;

    std::fs::create_dir_all(&log_dir)
        .map_err(|e| format!("Failed to create log dir: {}", e))?;

    let file_appender = RollingFileAppender::new(
        Rotation::DAILY,
        log_dir,
        "application.log",
    );

    tracing_subscriber::fmt()
        .with_writer(file_appender)
        .init();

    Ok(())
}

// Structured JSON logging for production
use tracing_subscriber::fmt::format::json;

fn init_json_logging() {
    tracing_subscriber::fmt()
        .json()
        .with_current_span(false)
        .with_span_list(true)
        .init();
}

// Output:
// {"timestamp":"2026-01-28T14:30:00Z","level":"INFO","message":"User logged in","user_id":123}

// Environment-based configuration
fn setup_logging() {
    let is_production = std::env::var("PROFILE")
        .unwrap_or_else(|_| "development".to_string())
        == "production";

    if is_production {
        init_production_logging();
    } else {
        init_development_logging();
    }
}

fn init_development_logging() {
    tracing_subscriber::fmt()
        .with_max_level(tracing::Level::TRACE)
        .pretty()
        .init();
}
Logging Best Practices
- Use Appropriate Levels: Choose correct log level for each message
- Add Context: Include relevant data with log messages
- Avoid Logging Secrets: Never log passwords or sensitive data
- Structured Logging: Use fields for searchable structured data
- Performance Aware: Minimize logging in hot paths
- Rotate Log Files: Implement rotation preventing disk fills
- Environment Configuration: Different levels for dev/prod
- Error Stack Traces: Include full stack traces for errors
- Correlation IDs: Track related operations across logs
- Log Aggregation: Consider centralized logging for production
Next Steps
- Testing: Unit and integration tests with testing guide
- Path API: File paths with path utilities
- Commands: Backend logic with Rust commands
- Events: Communication with event system
- Getting Started: Review basics with first app
Conclusion
Mastering logging and debugging in Tauri 2.0 enables building professional desktop applications with robust troubleshooting capabilities tracking application behavior, diagnosing issues efficiently, and monitoring production deployments maintaining comprehensive visibility into application operations catching errors early and resolving problems quickly through proper logging infrastructure. Logging system combines structured Rust backend logging with configurable levels and filtering, frontend console integration bridging JavaScript and Rust logs, DevTools access providing powerful debugging capabilities, error tracking with full context and stack traces, performance monitoring with timing measurements, and production file logging with rotation delivering complete observability solution. Understanding logging patterns including Rust backend setup with tracing crate and structured fields, frontend logging with custom logger classes and error reporting, DevTools integration with programmatic access and keyboard shortcuts, log level configuration with environment-based filtering, production file logging with daily rotation, and best practices maintaining performance and security establishes foundation for building professional desktop applications delivering efficient debugging and comprehensive monitoring maintaining application reliability through proper logging discipline developers and operations teams depend on!
$ share --platform
$ cat /comments/ (0)
$ cat /comments/
// No comments found. Be the first!