$ cat 2026-01-18
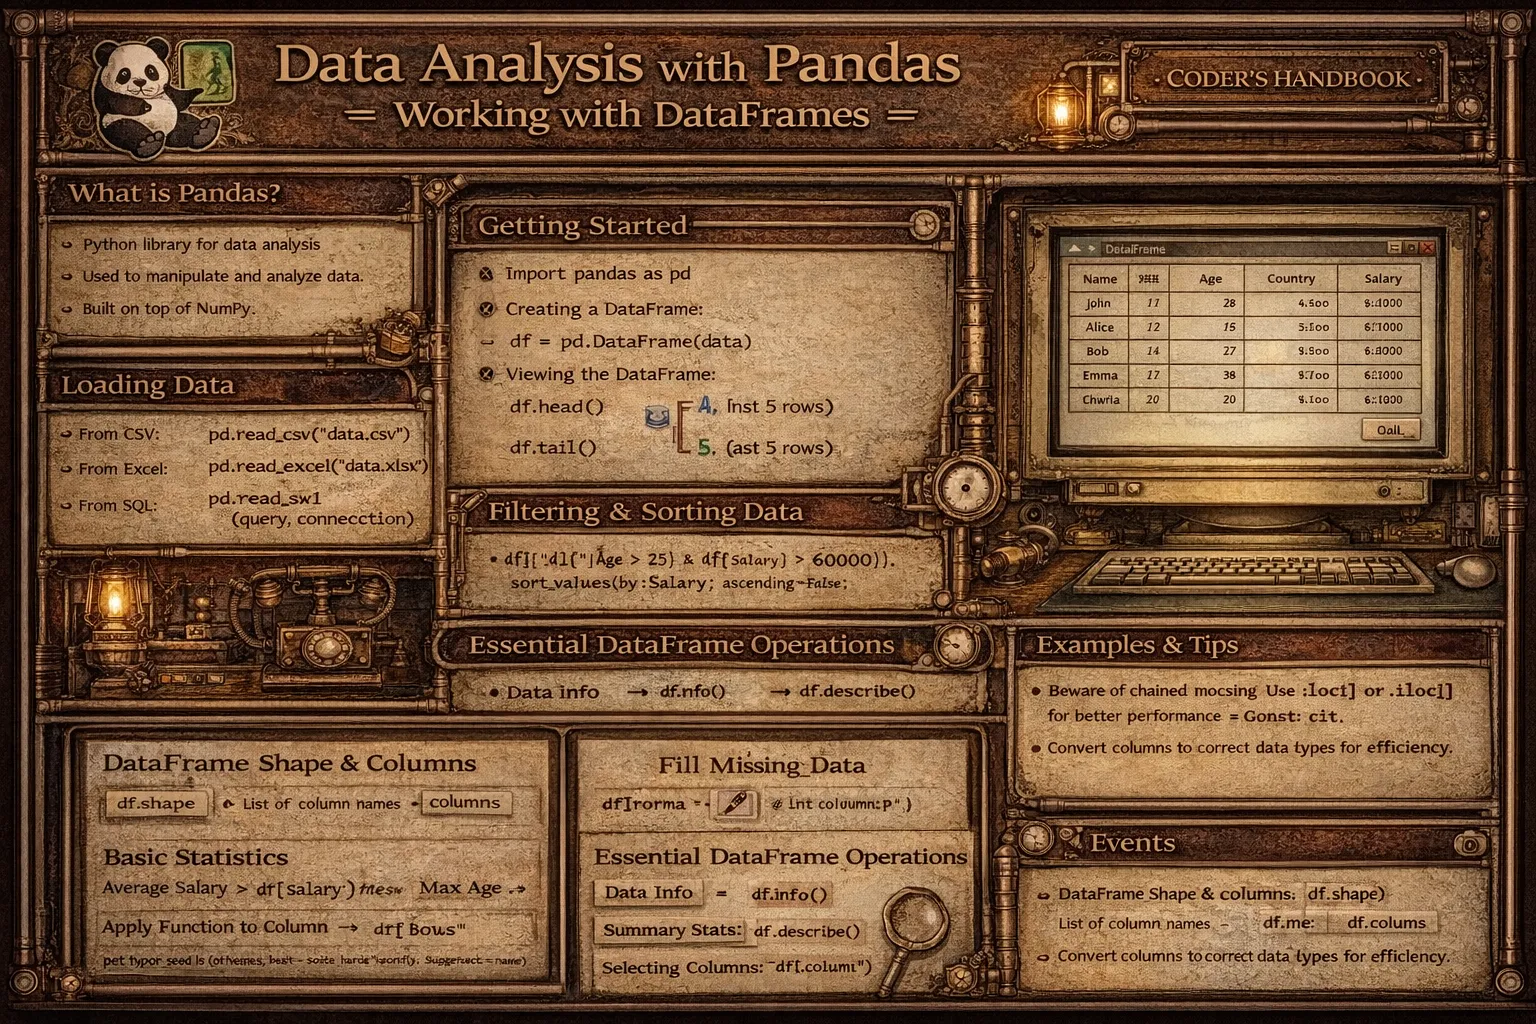
Data Visualization with Matplotlib: Creating Charts and Graphs
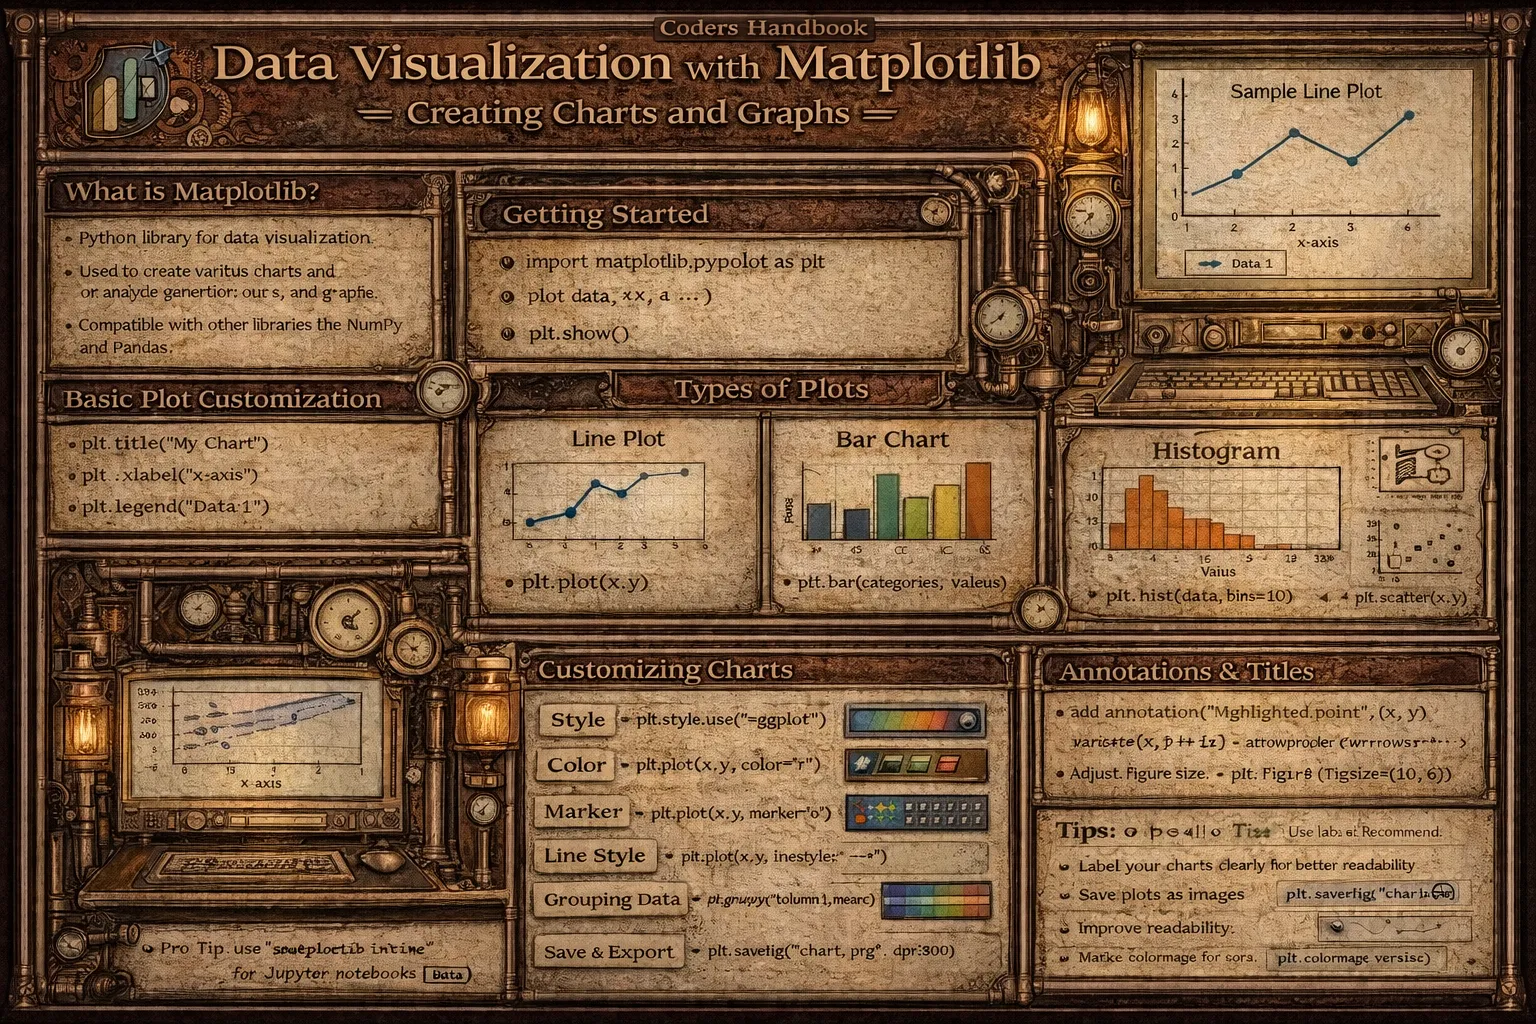
Data visualization transforms raw numbers into visual representations enabling pattern recognition, trend identification, and insight communication more effectively than tables or text. Matplotlib is...